Enterprise Resource Management
Gain more visibility into your budgets and resources
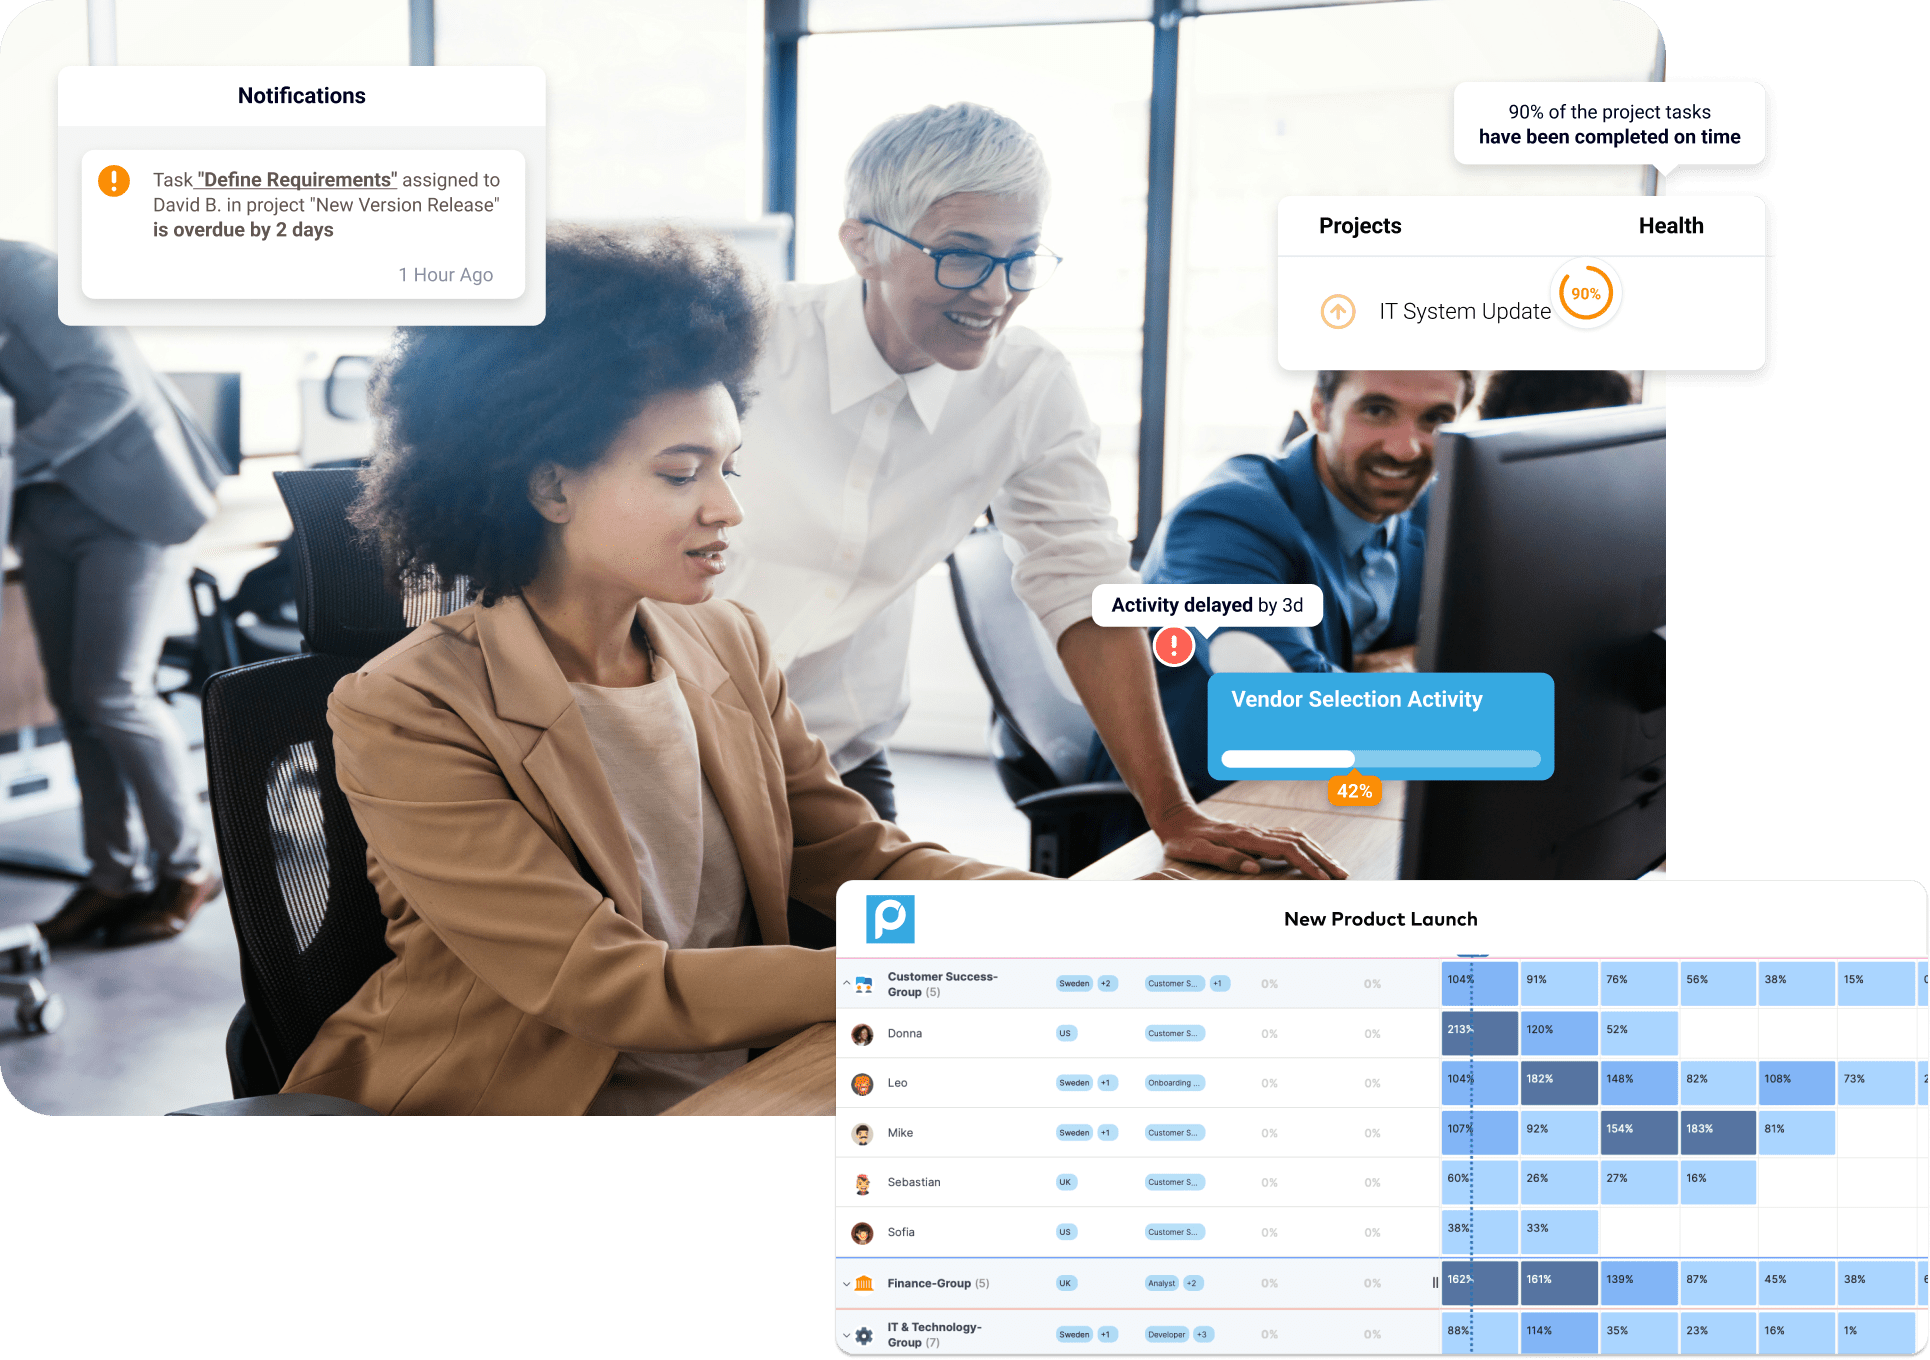
Enterprise resource control offers clear visibility, efficient processes, strong collaboration, accurate forecasting, and robust insights to make the right decisions again and again for your project workflow.


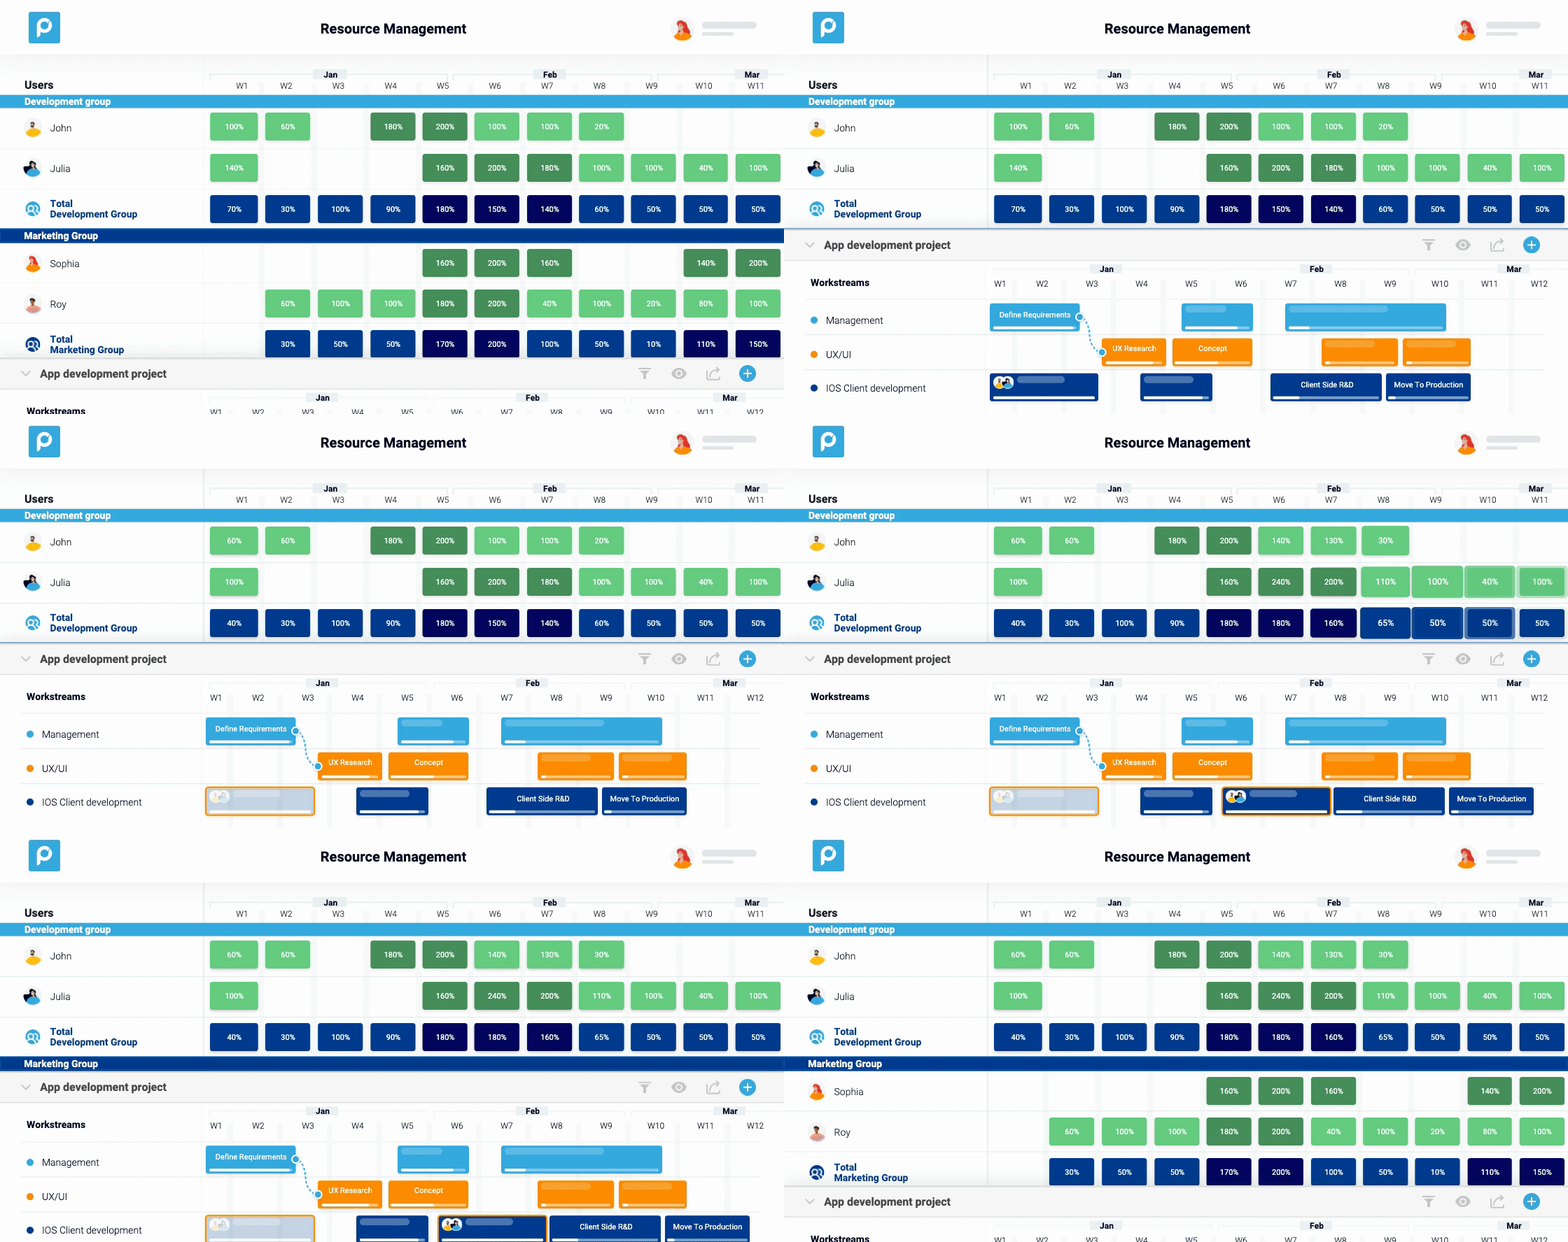
Staff Optimization ensures that nobody on the team is overworked or underutilized.
Resources are finite, and with how complex project portfolios can be, it’s essential to allocate resources properly. Proggio’s Staff Optimization feature gives you a clear visual of the workload divided amongst your staff. Have confidence while streamlining efficiency, and never wonder again how a project is going to get done on time.

Built-in time tracking for efficiency you can count on.
Proggio’s platform has built-in time tracking — so you can streamline efficiency — making it easy to track and view all the hours in your portfolio, all in one place.
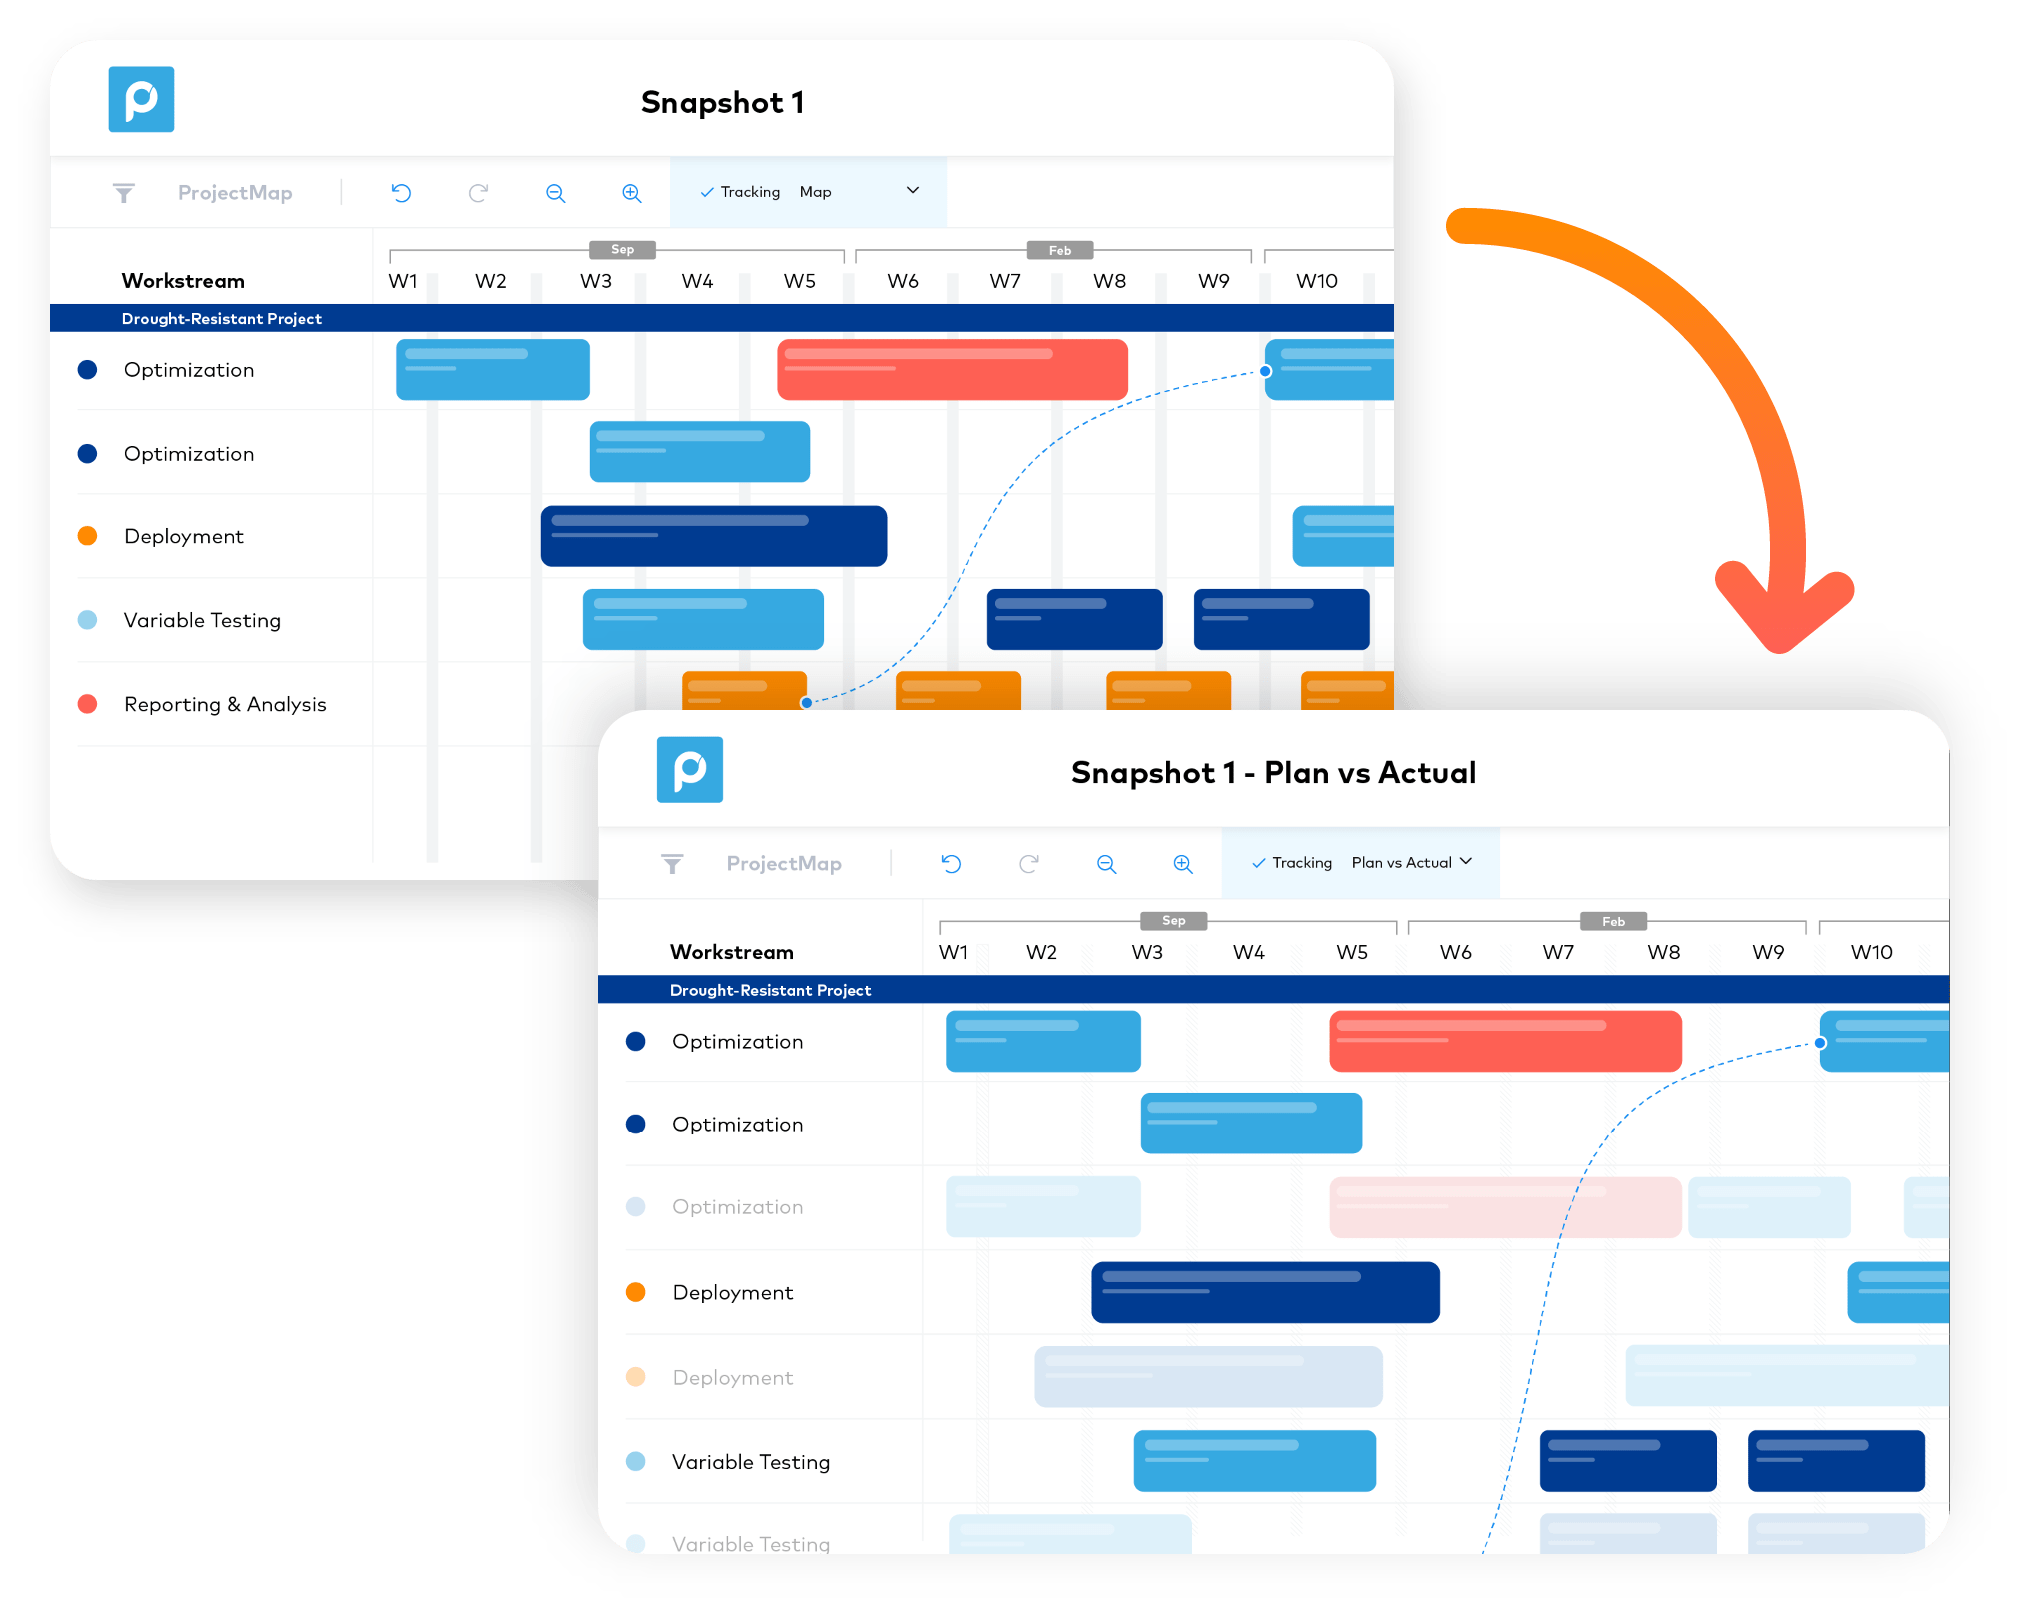
See all of your Plan vs. Actual updates in just a few clicks.
Plan vs. actual status update requests are frequent making it impossible to quickly show the data story needed to answer those requests. With Proggio, in a few clicks, you can take a picture of the baseline — or any other evolution that has had a snapshot taken before — and compare it to the current plan. So, you’ll always know how your projects have evolved.


Fill gaps based on groups and skills
Filter and search for resources based on user groups or single select skill. Easily see utilization of the resource and allocate as necessary.
Maximize efficiency and results
What if scenario planning allows you to prioritize analysis to enable your team to adapt and align to changes more rapidly.


Slice and dice your data
With advanced reporting pick and choose the data for your reports and display them in multiple ways – heat maps, stack charts, etc. – providing you a more powerful way to analyze your data for enhanced decision making.